

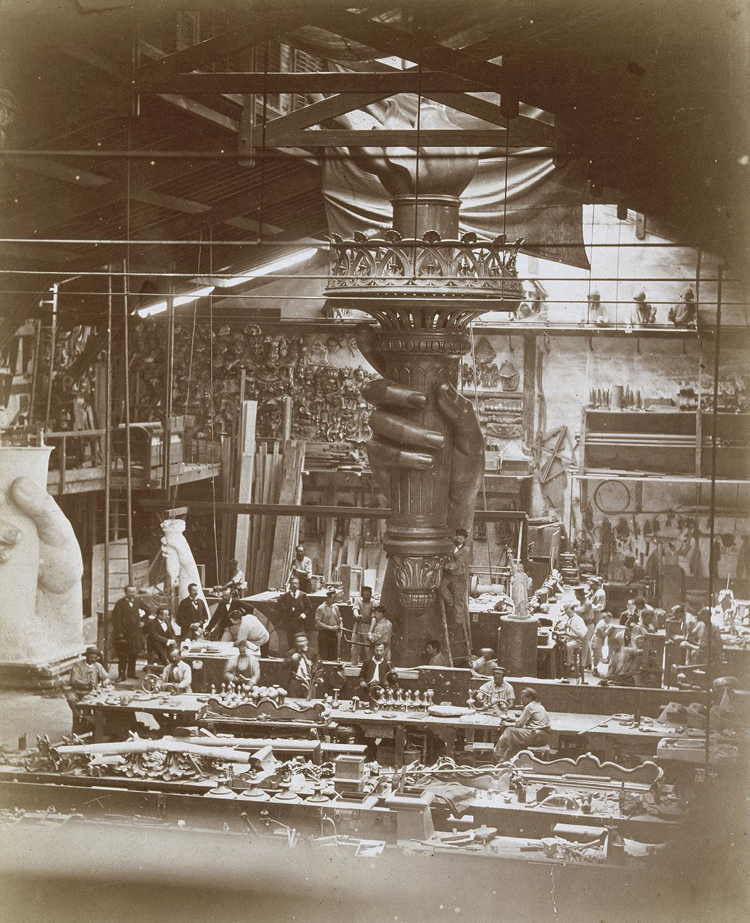
[Titian, “Sisyphus” (1548-49) – Sisyphus is pushing a boulder up to the summit in punishment for bringing enlightenment to the people. It might also represent classical liberals and libertarians pushing the boulder of liberty up the mountain of statism, only to see it roll back down again before they ever reach the summit.]
Updated: 11 July, 2022
Below is a list of my blog posts which are relevant to the Strategy Summit held in Sydney, 13-15 July, 2022.
Many are new; many were written for the CIS “Liberty and Society” Seminar in May, 2022; others come from another strategy position paper I wrote in March/April.
“Strategy Summit” blogs on the threats to liberty and strategies to counter them:
- “The Negative Political Party” (11 July, 2022) here
- “On Making the Argument/s for Liberty” (10 July, 2022) here
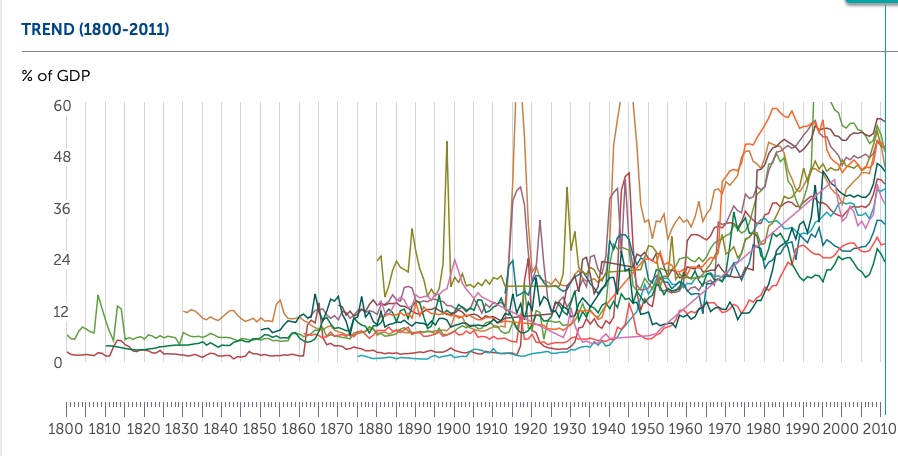
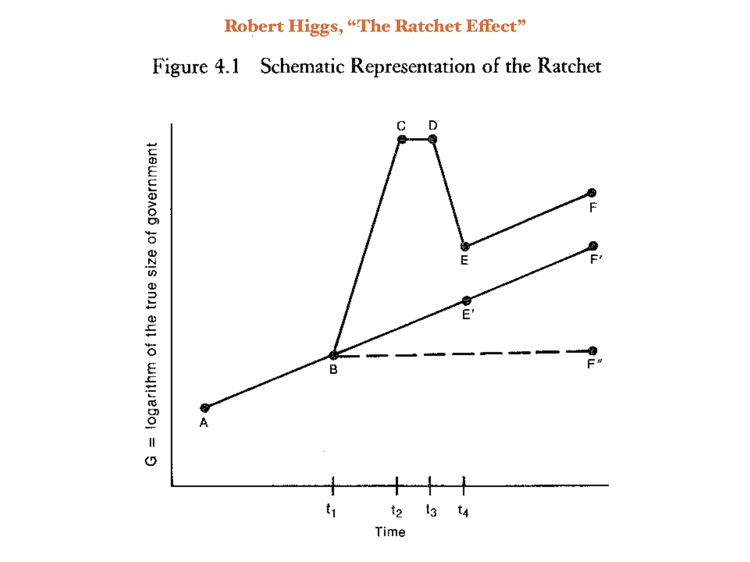
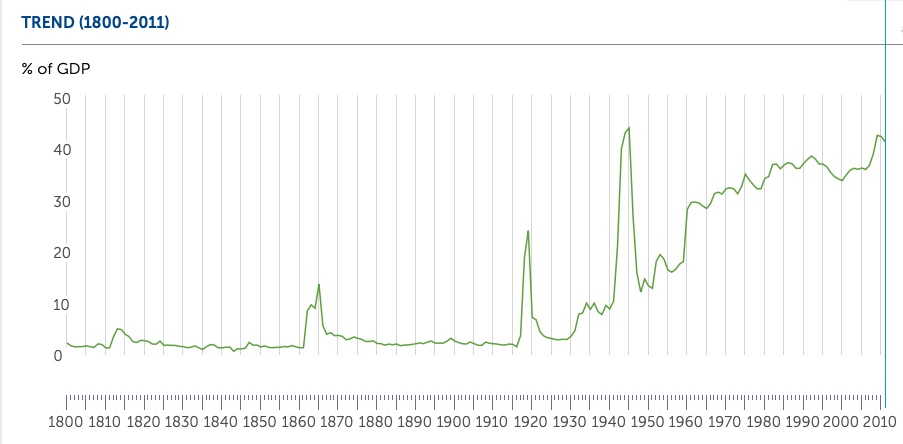
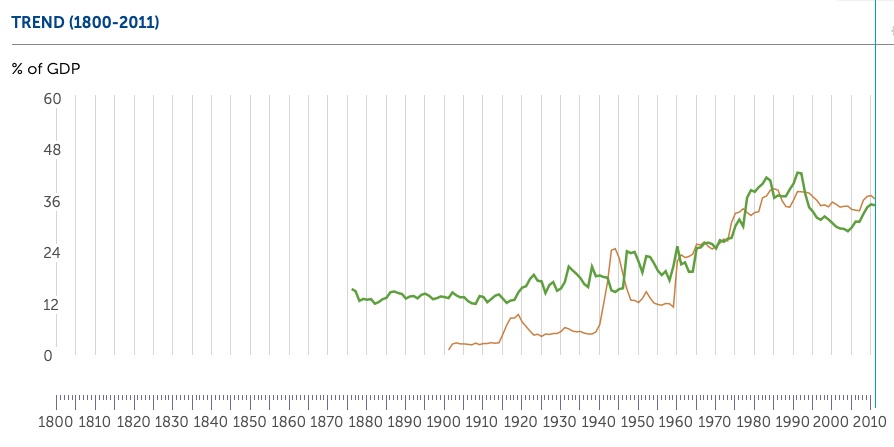
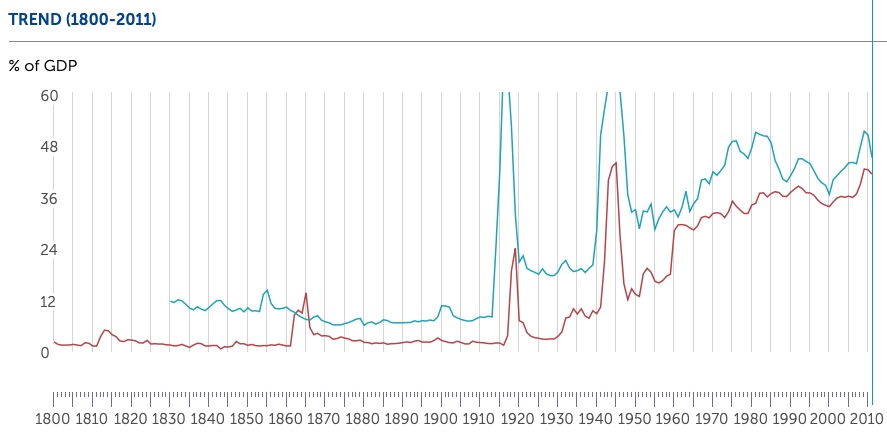
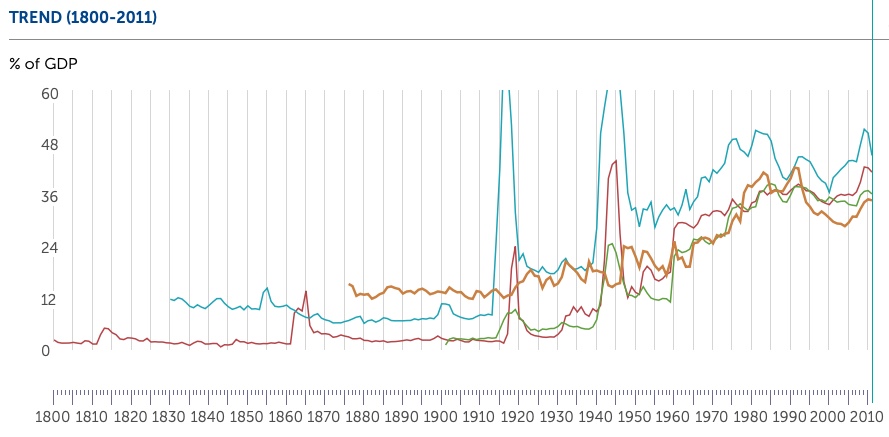
- “The Threats to Liberty Part 2: The Size and Power of the State” (7 July, 2022) here
- “The “Big Picture”: Part 1” (7 July 2022) here
- “The “Big Picture”: Part 2” (7 July 2022) here
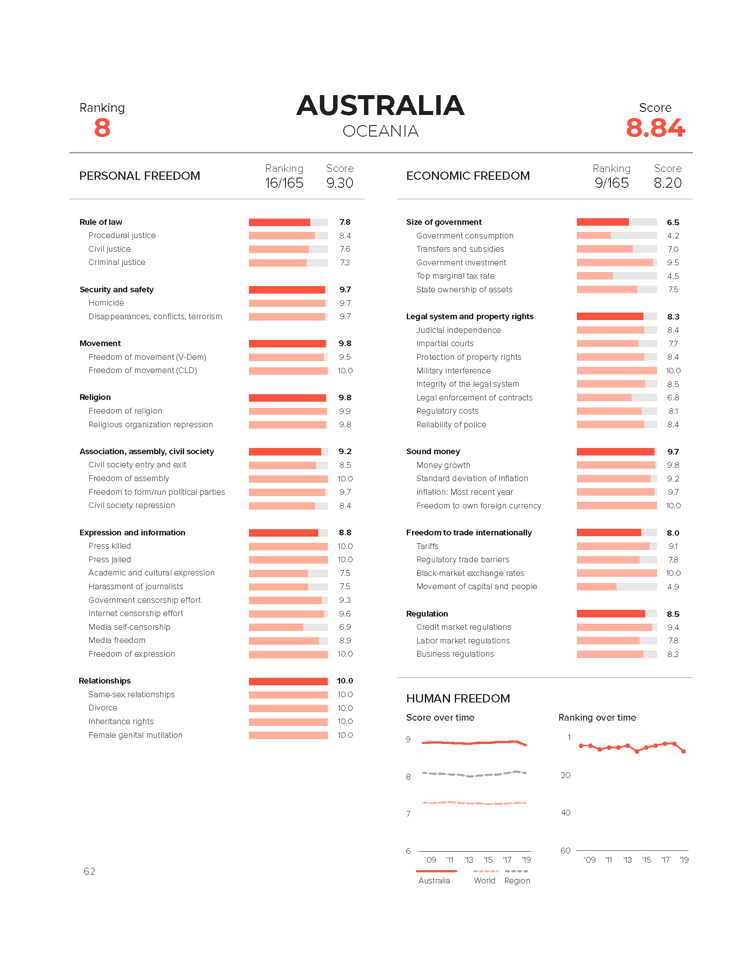
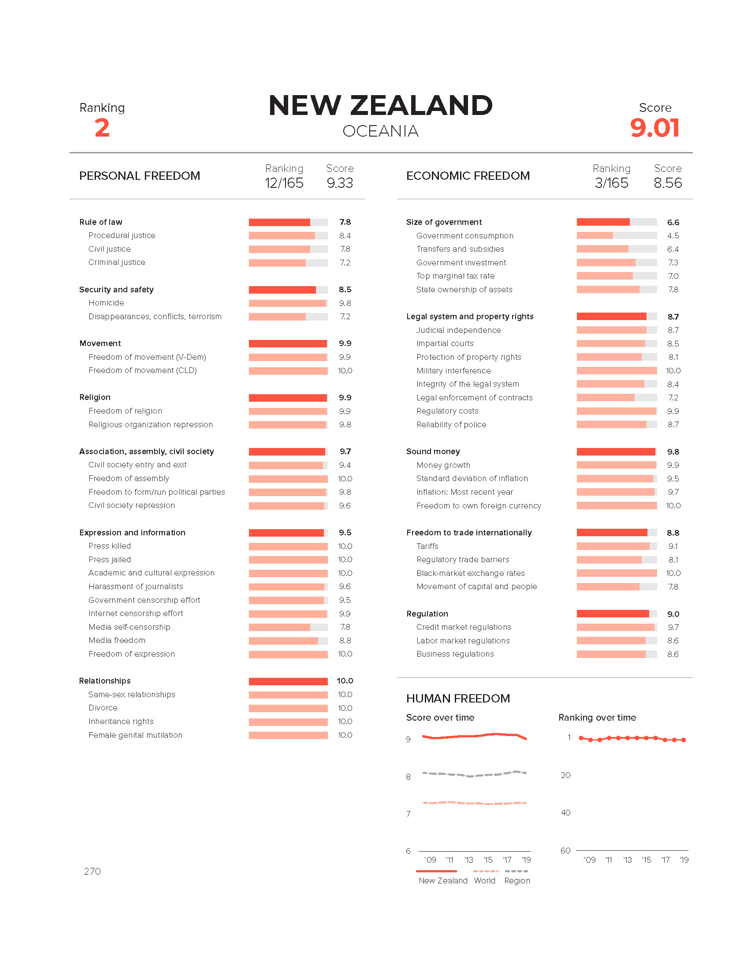
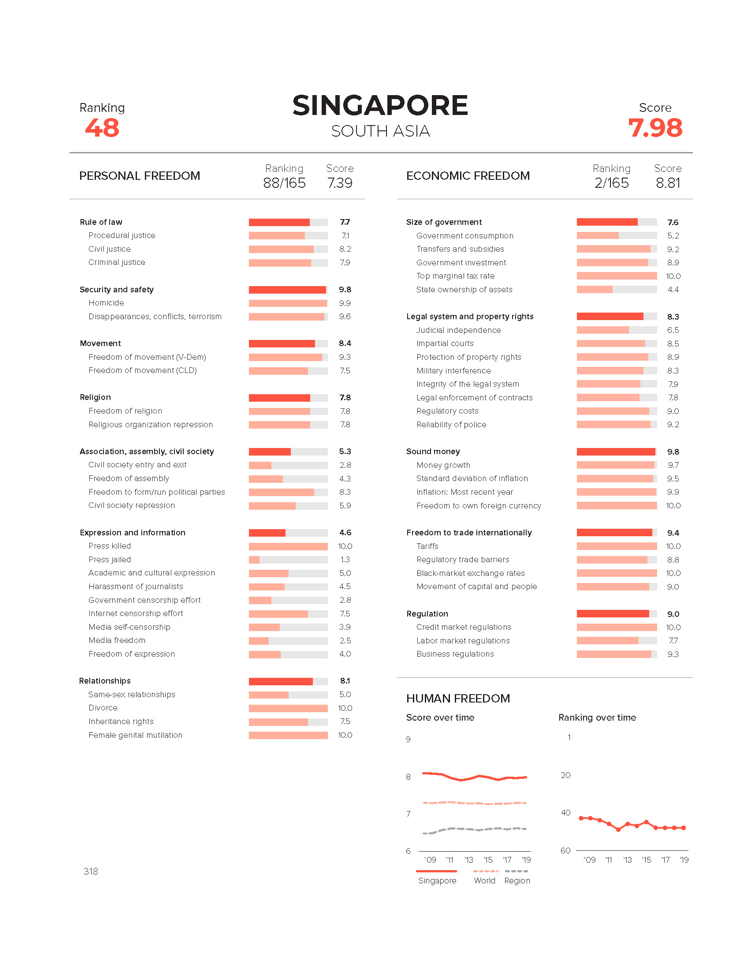
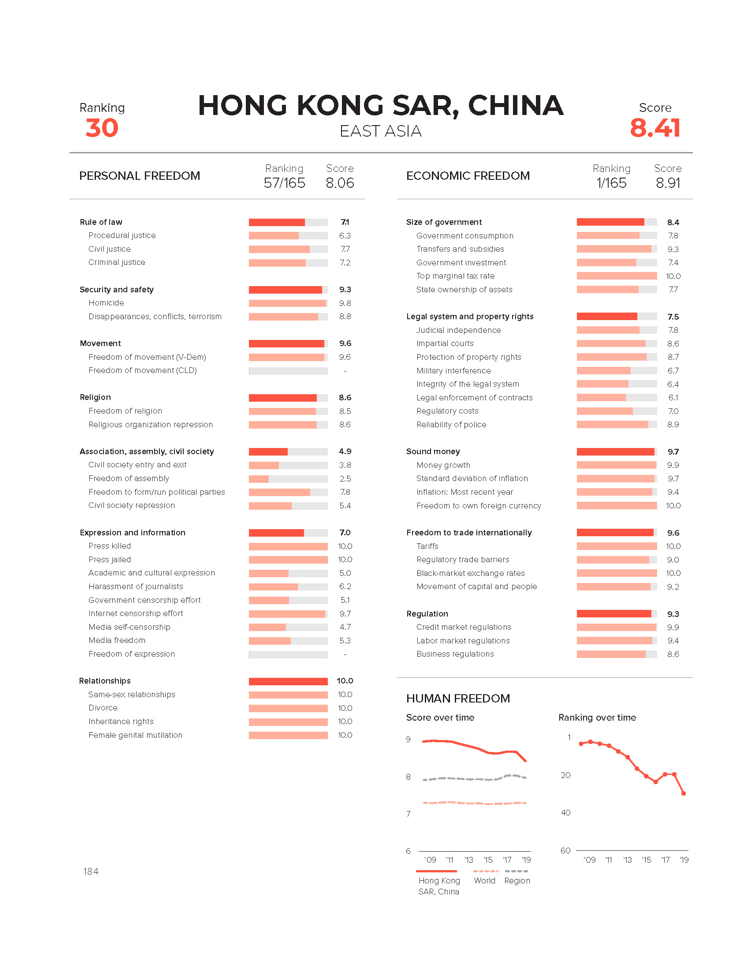
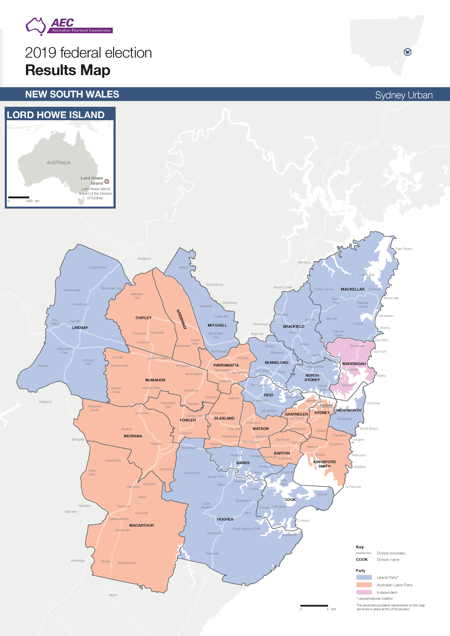
- “Liberty in Australia and the Asia-Pacific Region” (5 July, 2022) here
- “The Threats to Liberty Part 1: Government Expenditure” (29 June, 2022) here
- “The Prospects for Liberty: The Threats it faces and how to counter them” (23 March, 2022) here
Some blogs on the state of liberty and liberalism in Australia and elsewhere:
- “Liberty in Australia and the Asia-Pacific Region” (5 July, 2022) here
- “Some Thoughts on the May 2022 Federal Election in Australia” (26 May 2022) here
- On the “Linoleum Party” (LINO): “The Incoherence and Contradictions inherent in Modern Liberal Parties (and one in particular)” (21 Oct. 2021) here
- “The Myth of a liberal ‘Australian Way of Life’” (20 June 2021) here
- “The State of the Libertarian Movement after 50 Years (1970-2020): Some Observations” (25 March, 2021) here
- “The Presumption of Government Failure” (1 Jan. 2021) here
- “What is to be Done? The Rise of Hygiene Socialism and the Prospects for Liberty” (2 December, 2020) here
- “The Work of Sisyphus: the Urgent Need for Intellectual Change” (25 April, 2020) here
Some blogs on the history and theory of classical liberalism
A Brief Overview:
- “The History of Classical Liberalism in 1,730 words (and one picture)” (11 Aug. 2021; Revised 12 Apr. 2022) here
- “The Classical Liberal Tradition – A 400 Year History Of Ideas And Movements: Lecture/Seminar Outline” (22 Apr. 2022) here
- “Liberty as the Sum of All Freedoms” (26 April, 2022) here.
- “Twelve Key Concepts of Liberty” (25 Apr. 2022) here
The Many Faces of Liberalism:
- “The Multi-Dimensionality of Classical Liberalism” (19 April, 2022) here
- “Plotting Liberty: The Multi-Dimensionality of Classical Liberalism and the Need for a New ‘Left-Right’ Political Spectrum” (17 April, 2022) here
- “ ‘Hyphenated’ Liberalism and the Problem of Definition” (9 Aug. 2021) here
- “Hyphenated Liberalism Part II: Utopian, Democratic, Revolutionary, and State Liberalism” (12 Oct. 2021) here
- “The Conservative and Revolutionary Faces of Classical Liberalism” (11 Aug. 2021) here
- “How Modern Day CL/Libertarians Differ From “Classical” Classical Liberals” (24 Aug. 2021) here
- “On the (im)Possibility of finding a “Third Way” between Liberalism and Socialism” (19 Apr. 2022) here
Classical Liberals on the Role and Power of the State:
- “The Spectrum of State Power: or a New Way of Looking at the Political Spectrum” (10 Aug., 2021; updated: 25 Apr. 2022) here
- “Classical Liberals on the Size and Functions of the State” (10 Aug. 2021; updated: 25 Apr. 2022) here
What CLs were FOR and AGAINST:
- “What Classical Liberals were Against” (12 Aug. 2021) here
- “What Classical Liberals were For” (13 Aug. 2021) here
- “What CLs were For – Part 2: Ends and Means” (19 Oct., 2021) here
CL Visions of the Future Free Society:
- “Classical Liberal Visions of the Future I” (27 August, 2021) here
- “Classical Liberal Visions of the Future II: The Contribution of Gustave de Molinari (1819-1912)” (29 Aug. 2021) here
- “Classical Liberal Visions of the Future III: Liberal Experiments, Frameworks, and Archipelagos” (11 Oct. 2021) here
- “Hayek on a Liberal Utopia” (11 Sept. 2021) here
CL Movements and Crusades for Liberty:
- “Classical Liberal Movements: A Four Hundred Year History” (17 Aug. 2021) here
- “Classical Liberalism as a Revolutionary Ideology of Emancipation” (13 Oct. 2021) here
- “Classical Liberalism as the Philosophy of Emancipation II: The “True Radical Liberalism” of Peter Boettke” (17 Oct. 2021) here
CL’s Successes and Failures:
- “The Success of Liberal Ideas has led to the Decline of Radical Liberal Parties” (6 Sept. 2021) here
- “A Balance Sheet of the Success and Failures of Classical Liberalism” (21 Apr. 2022) here
Some things to read:


