
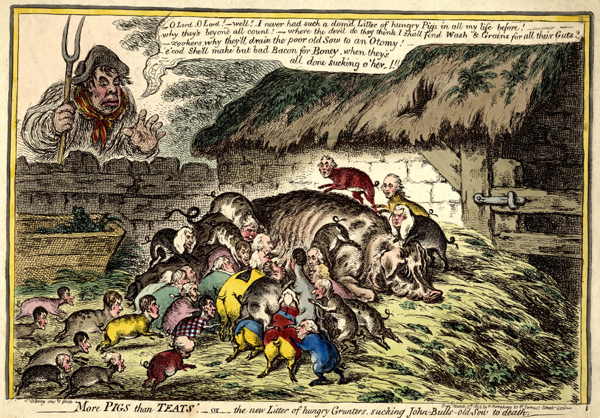
[James Gillray, ”More PIGS than TEATS, or the new Litter of hungry Grunters sucking John Bull’s old Sow to death” (1806)]
Note: This is part of a collection of posts on “The Current State of Liberty and the Threats it faces”.
In Part 1 I discussed state expenditure now and historically in “The Threats to Liberty Part 1: Government Expenditure” (29 June, 2022) here.
In this post I want to discuss “The Size and Power of the State” by looking at a few indicators concerning public sector employment and the bureaucratic structure of the government, especially in Australia.
The size and power of the state can be measured in a number of ways. In a previous post I listed the following indicators as important:
- how many people worked for the state in institutions such as the military, the courts, the customs service, the police, the diplomatic service, the post office, and so on
- how many people received benefits or privileges from the state in the form of monopolies, subsidies, restrictions on competitors, hand-outs, pensions, “civl lists”, and so on
- how much money was taken by the government from the people in the form of taxes, excise, tariffs, fees, and in kind (such as forced labour)
- how much did the government spend on its various activities in the form of income received from taxes, sales of goods and services from government owned enterprises, fees, and borrowings from government banks (Central banks), private banks and investors.
- how much burden (cost) did the government place on people in the form of prohibitions on work, buying and selling, entering an occupation of one’s choice, and regulations in general
- how many people did the state kill or imprison for engaging in economic and other activities which the state did not approve of
In this post I want to look at how many people work for the state and in what capacity, and how states are organized to employ these people to administer, regulate, and redistribute people, money, and economic activity to achieve its goals.
- How many people work at “the sharp end” of government, i.e. in the military, and how much does the state spend on this
- How many people work for the government in its other capacities, i.e. HEW, regulating private and economic life, and how much does the state spend on this
- How the government is structured to carry out these tasks, i.e. the number of departments and other entities under its control.
Countries Ranked in Size by Total Revenue and Expenditure
This table gives us some idea of which are the biggest and most powerful states on the planet, ranked by total revenue and expenditure. The US is by far the biggest and most powerful state with total expenditure close to $10 trillion; Germany is 3rd with $2 trillion; France 5th with $1.6 trillion; Britain 6th with $1.4 trillion; and Australia is a surprising 12th with close to $600 million.

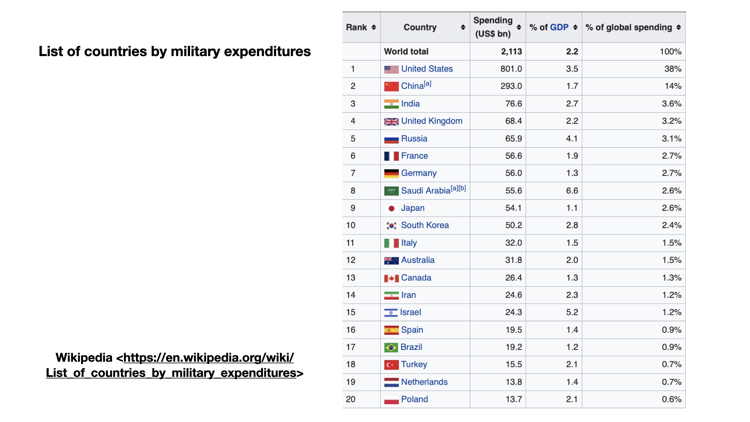
Military Personnel and Expenditure
One indicator of a country’s power is the size of its military, the number of its military personnel, and how much the state spends on this. The table shows that the US is by the far the most powerful state when it comes to military spending at $801 billion p.a. which is 3.5% of its GDP. Australia comes in at no. 12 with $31 billion p.a. which is 2.0% of its GDP.
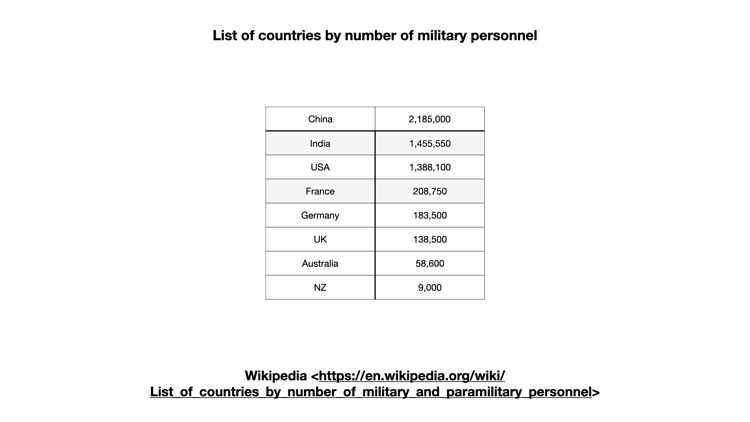
A second indicator is the number of military personnel. China and India have the highest number, which is not surprising given the sheer size of their populations. The US is ranked 3rd with 1,388,100 active military, and Australia is ranked 59th with 58,600; NZ is ranked 129th with 9,000 personnel.
Another indicator of military power is the number of times a state interferes militarily in the affairs of other nations. I will not go into this aspect here, only to note that Australia has been very active in fighting alongside Britain and then the US in overseas wars, and in numerous “peace keeping” actions.
Public Sector Employees
State spending on the military used to be the single biggest item in the budget until it was replaced by spending on health, education, and welfare HEW in the 20thC. The dramatic rise in “social spending” (as opposed to “anti-social” spending??) since the 1930s can bee seen in this graph.
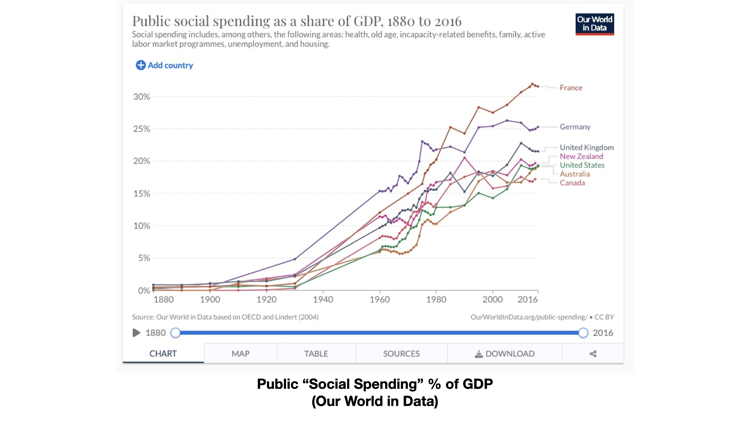
In 2016 France spent 31.55% of its GDP on “social spending”; the UK 21.49%; the US 19.32%; and Australia 19.15%.
Another way to measure this is the number of public sector employees as a percentage of the total workforce, shown in this table:
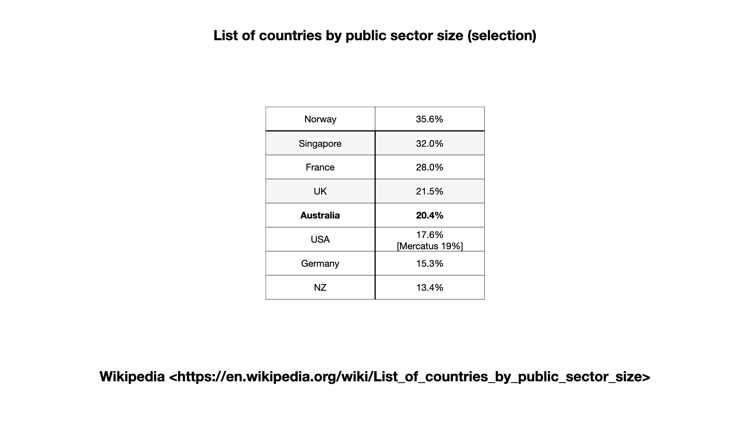
Scandinavian countries, like Norway (35.6%), with a large welfare state rank very high in spite of the fact that other areas of their economic are highly competitive and exposed to the world market. France is also high at 28%; the UK is 21.5%; Australia is 20.4”; the US is 17.6% (although the Mercatus Insitute calculates the level as 19%); and NZ is surprisingly low at 13.4%.
The Public Sector in Australia
Turning to the size of the public sector in Australia the following tables are informative.

The above table shows the number of public sector employees and the total amont spent on their wages/salaries at the Commonwealth, State, and local levels. By far the biggest employer are the states with 1,662,400 employees (led by NSW with 495,900 employees, followed by Victoria with 399,600 employees), and with the Commonwealth employing a relatively modest number of 247,600. The total number of public sector employees in Australia is 2,100,800 which cost the Australian taxpayers a total of about $183 billion out of total revenue of $593.2 billion or 31%.
The breakdown of where these public sector employees work is interesting:
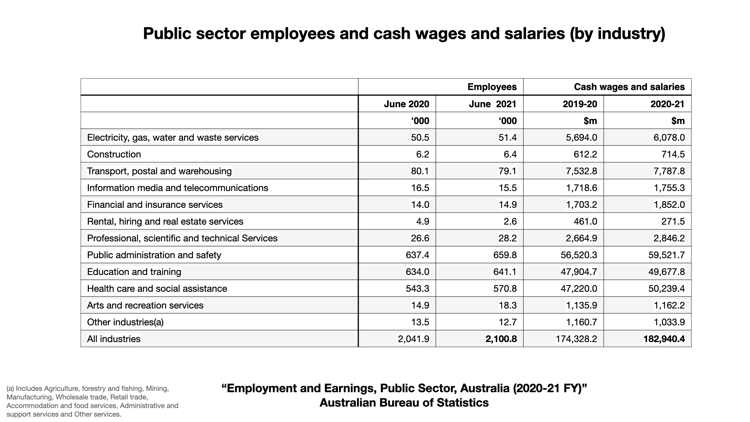
This table shows that the majority are employed in the following three areas
- Public administration and safety – 659,800
- Education and training – 641,100
- Health care and social assistance – 570,800
for a total of 1,871,700 or 89% of the total.
The Bureaucratic Structure of Government
The millions of public sector workers in Australia, as elsewhere, are organized into a bewildering array of departments, agencies, bodies, and “entities”, the true extent and cost of which are hard to determine. Although there is a huge amount of information is accessible online, it is often hidden in plain sight, buried under mountains of detail, or divided across more than one website. What I would like to know and have more readily available in one location is the following:
- how many and what kind of government entities exist and what they do exactly do
- how many people work for them and how much do they cost
- what are the salaries and benefits of those at the highest levels
For example, I have been able to find three interesting and very densely packed summaries of some of this information. The NSW government provides a “Governance Arrangements Chart” here in PDF; the Commonwealth government provides a “FlipChart” of Commonwealth Government Entities & Companies here of here in PDF; and the Commonwealth’s online “Australian Government Organisations Register (AGOR)” here.
What struck me was the astonishing number of such entities and the complexity of their arrangement / structure.
Below is a small section of the Federal government “Flipchart” as the entire piece is too large to display in a blog post:

The Commonwealth of Australia
We learn that the Commonwealth has 16 Departments or “Portfolios” (NSW on the other hand has “Clusters”) with an additional 4 departments called “Parliamentary Departments”. These Departments are in turn made up of 187 (or 189 depending on the source of information) “Principal Bodies”, which in turn are made up of a total of 1,306 individual bodies.
For example, the AGOR reveals that there are:
- Principal bodies (187 or 14%) – bodies connected with government policies, purposes or services which are prescribed under the Public Governance, Performance and Accountability Act 2013 and the related rules.
- Secondary bodies (677 or 52%) – committees, councils, boards, statutory office holders, consultative bodies and working groups linked to the Australian Government.
- Other bodies (442 or 34%) – Subsidiaries of corporate Commonwealth entities and Commonwealth companies; Joint ventures, partnerships and other companies; National Law bodies; and Bodies linked to the Australian Government through statutory contracts, agreements and delegations.
These in turn were composed of 12 groups of “bodies” known as “governance types” (labelled “A” to “L”):
- A. Non Corporate Commonwealth Entity – 98
- B. Corporate Commonwealth Entity – 71
- C. Commonwealth Company – 18
- D. Advisory Body – Policy and Stakeholder Consultation – 284
- E. Statutory Office Holder Offices and Committees – 224
- F. Non-Statutory Function with Separate Branding – 34
- G. Ministerial Councils and Related Bodies including those Established by the COAG – 59
- H. Inter Jurisdictional and International Bodies – 76
- I. Subsidiaries of Corporate Commonwealth Entities and Commonwealth Companies – 118
- J. Joint Ventures, Partnerships and Interests in Other Companies – 234
- K. National Law Bodies – 26
- L. Bodies Linked to the Australian Government through Statutory Contracts Agreements and Delegations – 64
For a total number of “bodies” – 1,306.
The State Government of NSW
Similarly with the image of the NSW “Governance Arrangements Chart”, since it too big and complex to display in a blog post, here is a snippet:
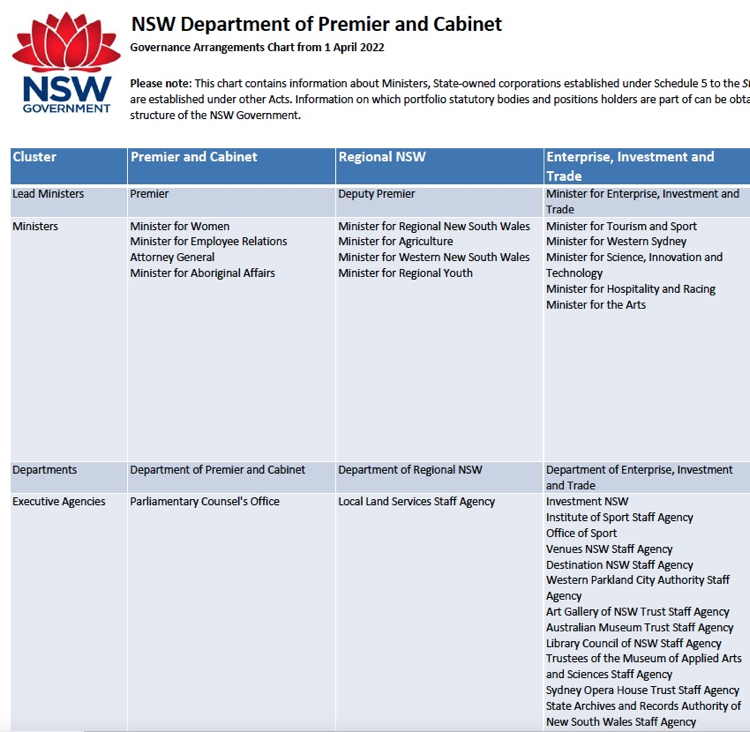
Concerning the NSW government (with the help of the Wikipedia article “List of New South Wales government agencies” here) we learn that it is bureaucratically organised into 10 “clusters” or “super” ministries, which include (the clusters in quote marks have especially inappropriate names):
- Premier and Cabinet – 3,835 employees
- Regional NSW – 4,428
- Enterprise, Investment and Trade – ?
- Treasury – 2,293
- Health – 124,086
- Education – 110,507
- “Stronger Communities” – 52,342
- Transport – 26,454
- “Customer Service” – 8,210
- Planning and Environment – 16,103
which in turn are made up of the following components:
- 39 departments, which are the lead agencies in each cluster
- 28 executive agencies, which are agencies related to the departments
- 4 “other services”, which include the large “Health Service” (127,156 employees), NSW Police Force (21,879 employees), the “Teaching Service” (99,702 employees), and the “Transport Service” (13,645 employees)
- 19 separate agencies, which operate independently of departments but can still be within clusters
- 8 state-owned corporations
- 10 universities (37,238 employees)
- statutory authorities, which are established under legislation but sit outside clusters
- subsidiaries of the NSW Government established under the Corporations Act
- councils under the Local Government Act (possibly 54,900 employees)