
This recent election was the first election I have observed close up since my return to Australia in 2020. My wife and I haven’t voted for 47 years. The last time was in 1975 when we voted for the Workers Party, which, if you don’t know, was very libertarian in spite of their provocative name (I have put their Platform online here. Since then we have escaped fines and other harassment for not voting, which we do not think should be compulsory. [The current fine for not voting is $55 – see here for details “What Happens If I Didn’t Vote”, NSW Electoral Commission.]
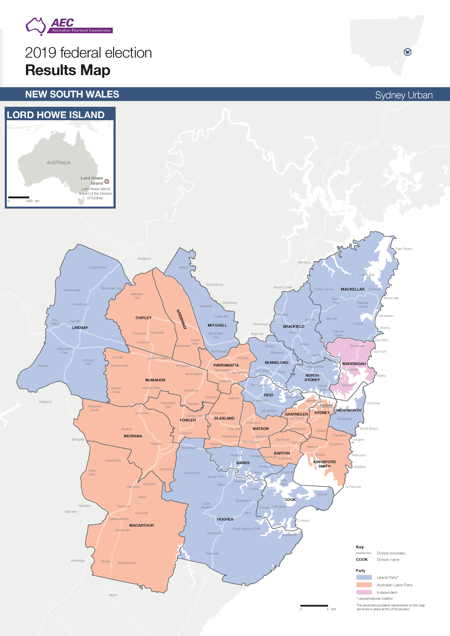
In many ways it was discouraging for someone in the liberty movement to watch the events of the past few weeks unfold with barely a mention of issues which are most dear to me. In my own electorate of Mackellar (Sydney, Northern Beaches), held by a “moderate” liberal Jason Falinski (i.e., he is a LINO – “liberal in name only”) in what had been a very safe Liberal seat, there was a massive swing, via preferences, to one of the “Teal” independents who won handily. [On LINOs see “The Success of Liberal Ideas has led to the Decline of Radical Liberal Parties” (6 Sept. 2021) here.]
On the other hand, my spirits rose when I began thinking about all those who didn’t vote for our new rulers (more on this below). In order to get this election into some kind of perspective I looked at the data on the Australian Electoral Commission website [for the 2022 election results; for the 2019 election results] and found some interesting nuggets which have not been reported by the mainstream media. Here is what I found.
The low voter turnout
I was surprised at how many people did not even show up to vote on election day this year which suggests that there is large section of the voting public who are disillusioned with or disengaged from politics and the major parties. Since there is compulsory voting in Australia I had thought there would be 90-95% turnout (or “compliance” with a government order backed up with a fine). This was the case in previous elections. For example, in the 2019 election there were 16,419,543 eligible voters who had been enrolled. Of these 15,088,616 (91.89%) voted, either “formally” (14,253,393) (i.e. government approved votes) or “informally” (835,223) (i.e. government non-approved votes) and there were 1,330,927 (8.11%) who did not show up to vote on the day.
When you add the number who did not vote at all to those who voted “informally” (and whose vote thus “did not count”) we have a total of 2,166,159 voters who make up what I have termed the “block of disillusioned or disengaged voters” which in 2019 was 13.19% of all eligible voters.
Contrast this with the precipitous decline in voting in the May 2022 election. In May 2022 there were a total of 17,228,900 eligible voters of whom 12,822,068 voted (made up of 12,177,265 “formal” votes and 644,803 “informal” votes) which was 75.07% of the eligible voters. There were also 4,406,832 people who did not vote at all in the election for a number of reasons, comprising 24.93% of all eligible voters. This means that there were in 2022 4,947,233 (28.71% of all eligible voters) members of my “block of disillusioned or disengaged voters”, which was a massive increase of 2,781,074 over the 2019 election – an increase of 128.34%
At this level of voter participation one can now form a government with less than a quarter of all all eligible voters or barely a third of the primary vote before preferences have been distributed. In 2022, the Labor Party can form a government with 3.9 million votes or 22.86% of all eligible voters which converts to 32.34% of the formal vote before preferences are distributed. This of course means that 77% of the eligible voters did NOT vote for the new governing party. It also means that 76% did NOT vote for a “liberal” party, even in its ideologically gutted and illiberal form known as the Liberal Party (16.85% of all eligible voters and 23.84% of the formal vote). The Liberal Democrats, which should be seen as the Australia’s version of a Libertarian Party and the heir of the old Workers Party, got 204,827 votes which translates as 1.19% of all eligible votes and 1.68% of all formal votes. This was a very large increase over its results in 2019, although it came from of very low base figure. (See below for more details).
“Informal” and other protest votes

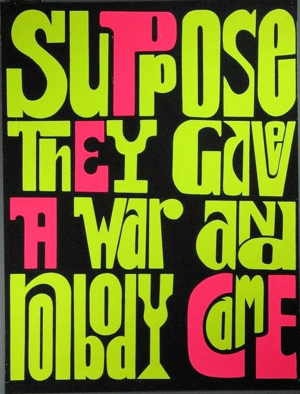
In my seat of Mackellar the list of candidates for the House of Reps was pretty dismal (both in terms of the character of the party they represented and their ideological positions) so I decided to vote “informal” as a way of protesting the limited selection of candidates and the way in which elections are seen as a “mandate” for ruling the country by whomever “wins” the election. The word “informal” is a derogatory term and carries the suggestion that the voter is stupid, uniformed, or careless for not being able to vote “properly” and thus has “wasted” their vote. I don’t think I am any of these things. I took a Sharpie pen with me and carefully drew a box at the bottom, labelled it “None of the Above”, and put a 1 in the box. I think this is a “thoughtful and considered vote” not a “wasted vote” as the mainstream press regards it. As a libertarian my dream is that one day a clear majority of the voters (if they bother to vote at all) will choose “None of the Above” and the seat will remain vacant. This is my version of the anti-war saying “what if they held a war and nobody came”, viz. “what if they held an election and nobody voted”. Where would their much vaunted “mandate” to rule be then? The Labor Party’s 23% of all eligible voters is a pretty feeble “mandate” in my view.
The collapse in the vote for the major parties
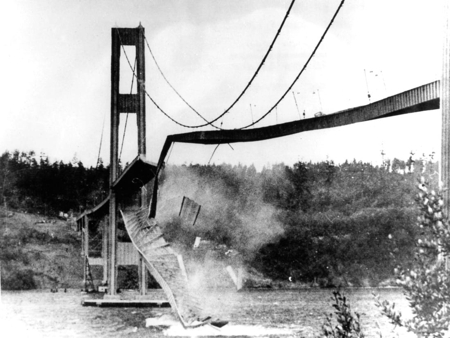
[Tacoma Bridge Collapse 7 Nov. 1940]
This collapse I believe is another indication of the increasing disillusionment of the voters with the political system as represented by the “major parties”, such as Labor, Liberal, and National. This must be added to the corresponding increase in the vote for “Independents” of various “colors” (“Teal in 2022 in particular) and for the group of disillusioned “non-voters” as discussed above. In what follows I compare the national results for the major parties between the 2019 and 2022 elections. The list below is in order of the size of the collapse (or increase) in the primary vote nationwide (% is of all eligible voters):
Liberal:
- drop in vote – from 3,989,404 in 2019 (24.29%) to 2,959,255 in 2022 (17.18%); a drop in absolute votes of 1,030,149 or 25.82% of the 2019 figure
Nationals:
- drop in vote – from 642,233 in 2019 (3.91%) to 486,796 in 2022 (2.83%)); a drop in absolute votes of 155,437or 24.20% of the 2019 figure
Liberal National:
- drop in vote – from 1,236,401 in 2019 ( 7.53%) to 970,901 in 2022 (5.64%); a drop in absolute votes of 265,500 or 21.47% of the 2019 figure
Labor:
- drop in vote – from 4,752,160 in 2019 (28.94%) to 4,046,234 in 2022 ( 23.48%); a drop in absolute votes of 705,926 or 14.85% of the 2019 figure
Greens:
- drop in vote – from 1,482,923 in 2019 (9.03%) to 1,450,874 in 2022 (8.42%); a drop in absolute votes of 32,049 or 2.16% of the 2019 figure
Parties/groups which saw an increase in their vote (or not voting):
Liberal Democrats:
- increase in vote – from 34,666 in 2019 (0.21%) to 207,903 in 2022 (1.21%); an increase in absolute votes of 173,237 or 499.73% of the 2019 figure
My “Block of Disillusioned or Disengaged Voters”:
- an increase from 2,166,159 in 2019 (13.19%) to 4,947,233 in 2022 (28.71%); an increase in absolute votes of 2,781,074 or 128.39% of the 2019 figure
Independents:
- increase in vote – from 479,836 in 2019 (2.92%) to 676,517 in 2022 (3.93%); an increase in absolute votes of 196,681 or 40.99% of the 2019 figure
One Nation:
- increase in vote – from 438,587 in 2019 (2.67%) to 599,438 in 2022 (3.48%); an increase in absolute votes of 160,851 or 36.67% of the 2019 figure
United Australia Party:
- increase in vote – from 488,817 in 2019 (2.98%) to 506,576 in 2022 (2.94%); an increase in absolute votes of 17,759 or 3.63% of the 2019 figure
In my own electorate of Mackellar these factors can be seen playing out as follows:
- the Liberal vote collapsed from 52,088 in 2019 to 37,082 in 2022 – i.e. 15,006 or 28.81%
- the Labor vote collapsed from 16,648 in 2019 to 6,859 in 2022 – i.e. 9,789 or 58.80%
- the Green vote collapsed from 11,283 in 2019 to 4,980 in 2022 – i.e. 6,303 or 55.86%
- the Independent candidate (not Teal) vote rose from 11,975 in 2019 to 34,516 in 2022 (Teal) – i.e. 22,541 or 188.23%
- my block of disillusioned/disengaged voters rose from 17,412 in 2019 to 25,924 in 2022 – i.e. 8,512 or 48.89%
It would be interesting to look at a previously safe Labor seat which changed hands to see how these factors played out there. I haven’t had the time to do that.
Conclusion
My conclusion from all this is that on the whole the Australian electorates is unhappy with the current state of politics and the behaviour of the major political parties. Thus, they either chose not to vote at all (up 49%), not to vote for one of the major parties (Liberals down 26%; Labor down 15%), to shift their “Green” vote from the “dark” green, hard-core Green Party (down 2% nationally) to a “light” green (Teal) independent candidate (all Independents up 41%), or to vote for an alternative party like One Nation (up 37%) or the Liberal Democrats (up 500% from a very small base).
How real classical liberals should react to this is up for discussion.