
See an earlier related post on “The Prospects for Liberty: The Threats it faces and how to counter them” (23 Mar. 2022).
Introduction: How Big is the State?
Before I discuss what are the biggest threats to liberty which we face at the moment we need to get some perspective on the size of the state and how it has grown over the past two centuries. Such a measurement should provide us with much information which is extremely difficult or even impossible to obtain, such as
- how many people worked for the state in institutions such as the military, the courts, the customs service, the police, the diplomatic service, the post office, and so on
- how many people received benefits or privileges from the state in the form of monopolies, subsidies, restrictions on competitors, hand-outs, pensions, “civl lists”, and so on
- how much money was taken by the government from the people in the form of taxes, excise, tariffs, fees, and in kind (such as forced labour)
- how much did the government spend on its various activities in the form of income received from taxes, sales of goods and services from government owned enterprises, fees, and borrowings from government banks (Central banks), private banks and investors.
- how much burden (cost) did the government place on people in the form of prohibitions on work, buying and selling, enter an occupation of one’s choice, and regulations in general
- how many people did the state kill or imprison for engaging in economic and other activities which the state did not approve of
I want to use total government expenditure as a percentage of GDP as a proxy for all these things in the absence of more detailed historical information. The International Monetary Fund has a very useful graph which shows this information going back to 1800 up to 2011 for many countries. An article on Wikipedia “List of countries by government spending as percentage of GDP” – Wikipedia cites IMF data up to 2020 which we also include.
Here is one graph which provides an overview for many countries showing the low level of government expenditure for most of the 19thC, with sharp increases during WW1, the Great Depression, WW2, and the post-war period IMF:
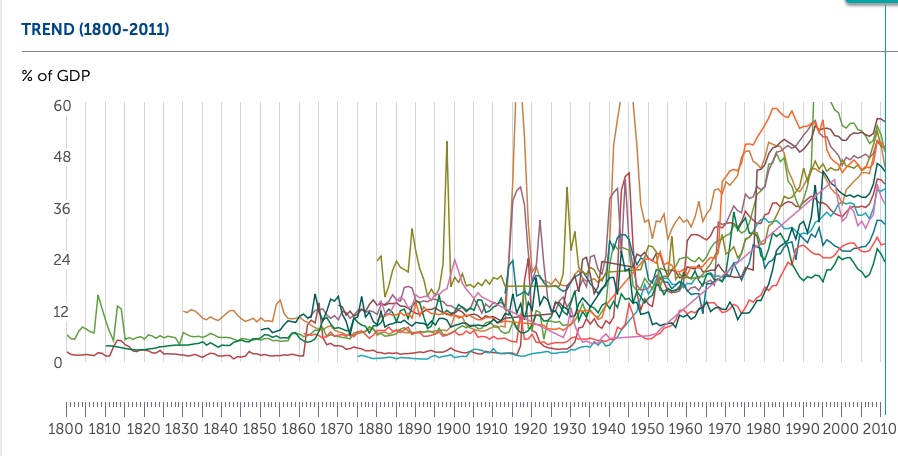
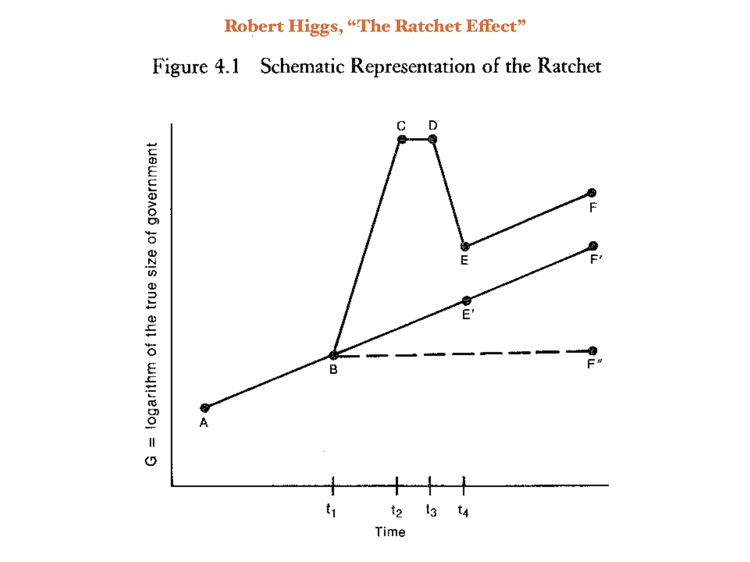
Something else to note is what the economic historian Robert Higgs has described as “the ratchet effect” whereby government expenditure increases during periods of crisis (war, depression) but does not return to its previously low level and thus “ratchets upwards” over time. [See Robert Higgs, Crisis and Leviathan: Critical Episodes in the Growth of America Government (Oxford University Press, 1987).]
These IMF graphs stop in 2011 shortly after the Global Financial Crisis and do not show the increase in expenditure caused by the most recent crisis, namely the Covid19 lockdowns and economic disruptions it caused, and the increase debt and government spending it brought in its train.
The Group of Five
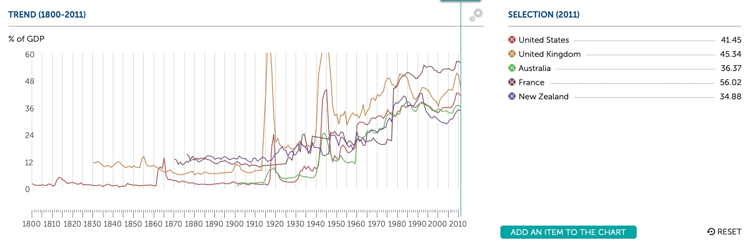
Here are the graphs for the particular countries of interest to us – US, UK, Australia, NZ, France:
See larger image
**The USA***
1800 = 2.35%
2011 =41.45%
2020 = 46.18%
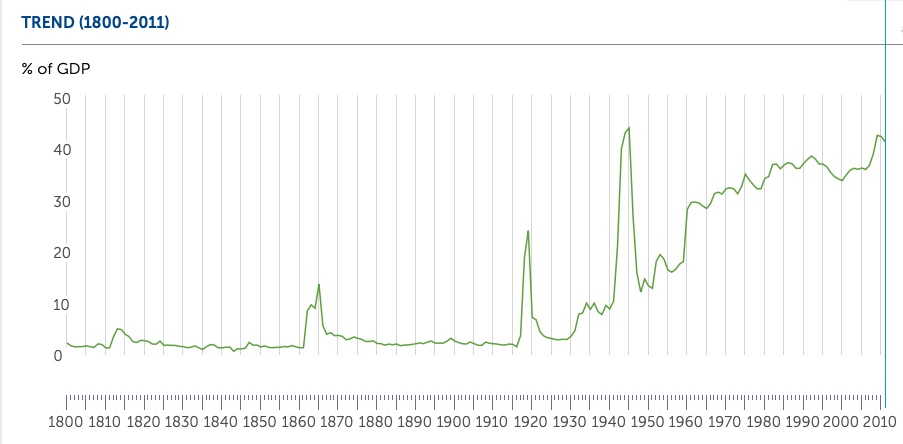
This is a near textbook example of the Higg’s “ratchet effect” of state growth.
Note the spikes in the War of 1812 (against UK), the Civil War, WW1, WW2, and after 1960 (Lyndon Johnson’s “Great Society” welfare program)
The UK
1830 = 11.83%
2011 = 45.34%
2020 = 50.27%%
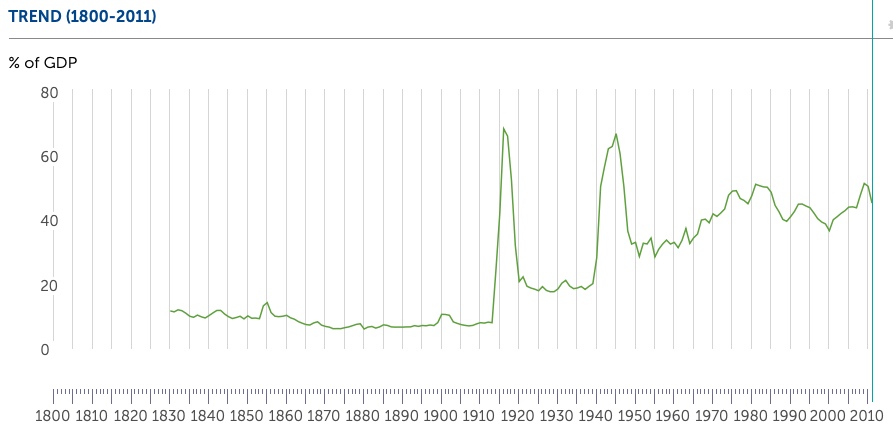
Note the slow and steady decline in 19thC during the free trade period, spike during Boer War, WW1, WW2, drop during Thatcher era.
France
1870 = 13.24%
2011 = 56.02%
2020 = 62.40%
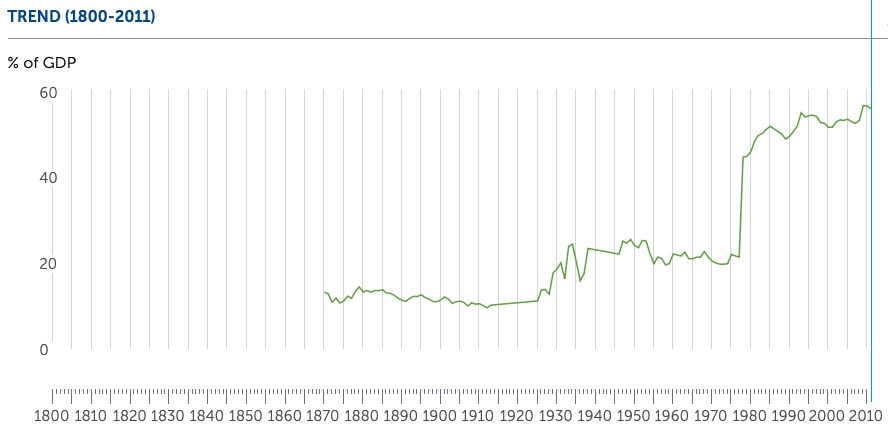
Note the spike during the Great Depression and very sharp spike after socialist Mitterand came to power.
Australia
1901 = 1.17% [low because Commonwealth had just been funded; previously state governments had played a greater role??]
2011 = 36.37%
2020 = 44.98%
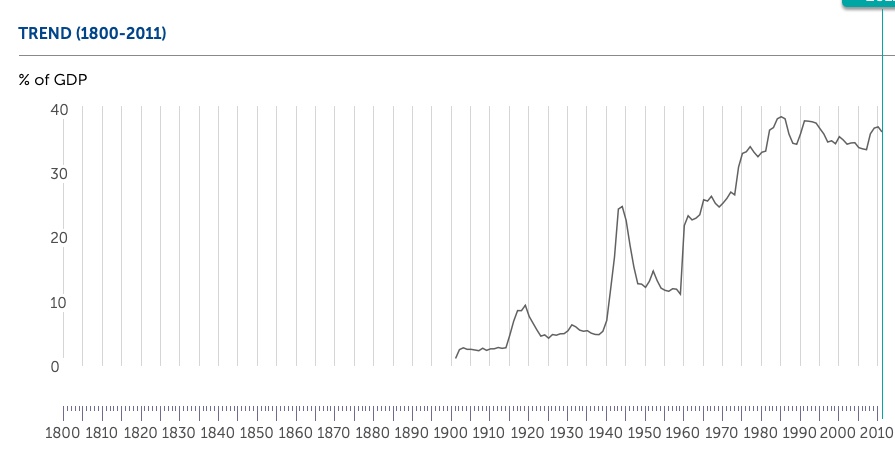
Note the spike in WW1, WW2, and 1960??).
New Zealand
1875 = 15.37%
2011 = 34.88%
2020 = 42.42%
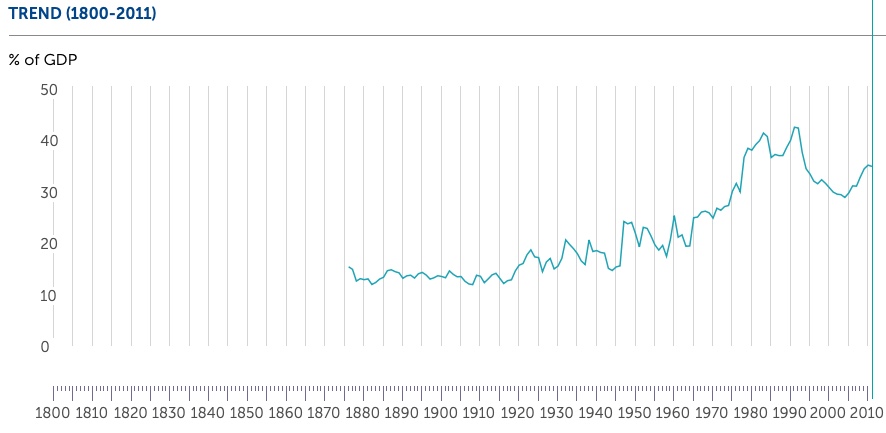
Note the higher level through late 19thC (period of “Colonial Socialism”), drop during the David Lange and Douglas government.
Australia and New Zealand compared
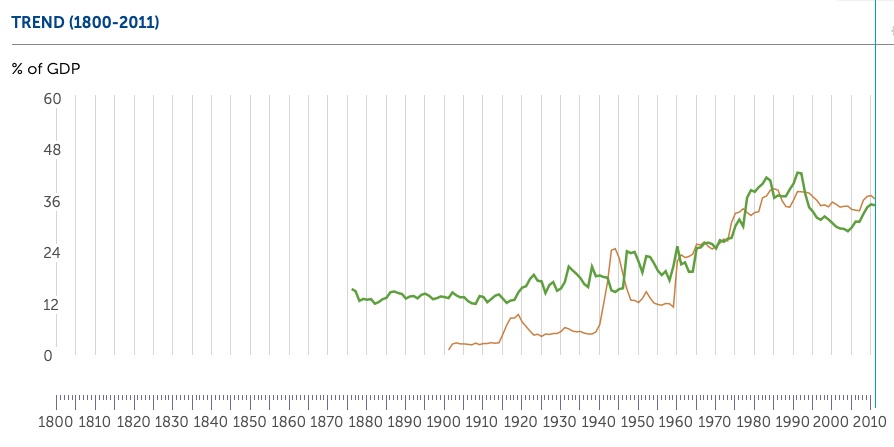
It is interesting to compare the periods of “market reform” experienced by Australia (brown) and NZ (green) under the Hawke-Keating government (1983-89) the Lange-Douglas government (1984-89), the Jim Bolger government (1990-97), the Howard government (1996-2007). The decline in government expenditure was steep under Lange only moderate under Howard.
The UK and the USA compared
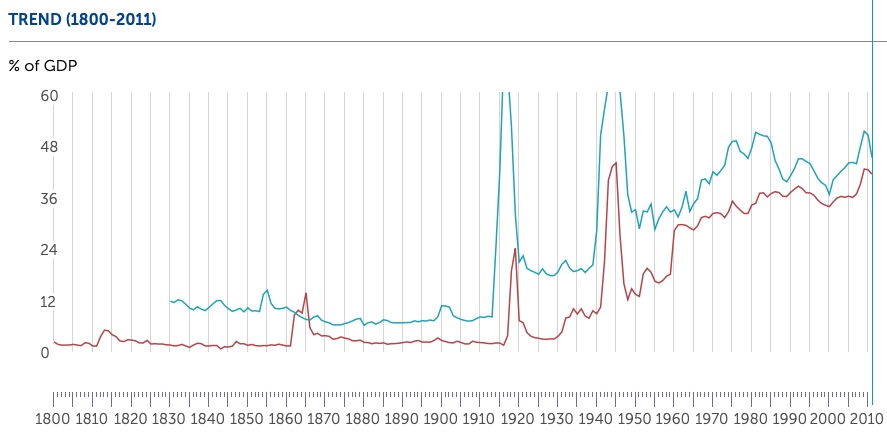
Another interesting comparison is between the UK under the government of Margaret Thatcher (1979-1990) (green) and the US under the government of Ronald Reagan (1981-89) (red). The decline in government expenditure was steep under Thatcher and non-existent under Reagan. The decline in the US actually took place under Bill Clinton (1993-2001).
The 4 Anglophone Countries compared
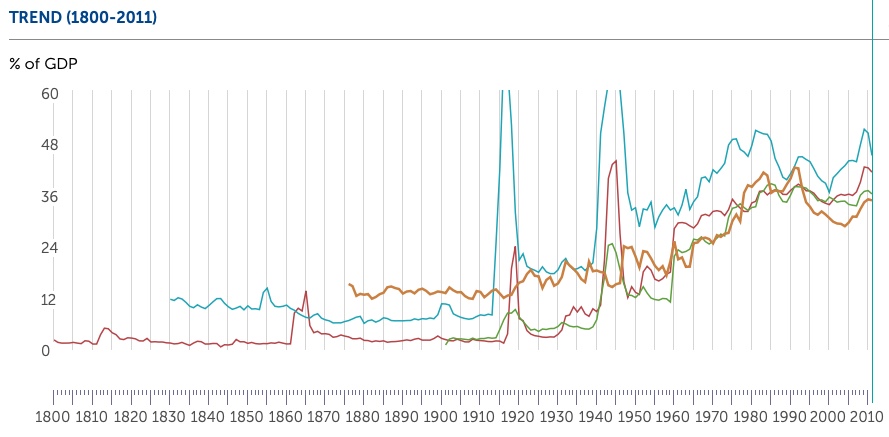
My conclusion is that the period of “market reform” in the 1980s and 1990s in all four countries was modest and only temporary, before the growth in government spending (and power) continued to follow the pattern set in the 20thC, namely steadily “ratcheting upwards”. The data for 2020 show that (in decreasing order):
- UK = 50.27%%
- USA = 46.18%
- Australia = 44.98%
- NZ = 42.42%
France is still “head of the pack” coming in at 62.40%. The UK under a nominally conservative government has now reached where socialist France was in the early 1980s.
What CLs thought of this level of Government Expenditure during the “Liberal Era”
Two of the most radical and consistent CLs of the late 19th century, Herbert Spencer (1820-1903) in England and Gustave de Molinari (1819-1912) in France, thought the high (by their historical experience) but relatively low (by our modern standards) levels of government were horrifying and appalling, and were rapidly approaching “socialist” levels. To give only one example, Spencer wrote a passionate essay denouncing “The Coming Slavery” (1885) link when the UK government’s spending was about 7% of GDP, and France’s was about double that at 13%.
Would that we CLs today had their problem.