
Introduction
There was a sizable swing in the 2022 Federal election to the DNV (did not vote) camp as well as the “informal” vote, though this is less marked with the revised updated results than with the early and incomplete result I used in my earlier post. I now calculate that the total number of people who did not vote or whose vote was “informal” and thus not counted (I+DNV) increased from 13.19% in the 2019 election to 14.84% in the 2022 election, or in absolute terms 388,241 people.
I think it is as important to take into account those who did not vote for a candidate or party as those who did. Not voting at all or not voting “properly” (i.e. in the state approved manner) is also an expression of a political viewpoint which needs to be taken into account when trying to understand voter attitudes. I call this the “negative vote” as opposed to the “positive vote” which most journalists and academics consider when analyzing the results of an election. And the combined vote of the DNV (did not vote) and the “informal” vote (I) might be termed the “negative candidate” who stands for a “negative political party”. This “negative political party” did quite well in the last election, coming 3rd behind the two major parties and ahead of the Greens in the House of Representatives with a combined vote of 2,554,391 or 14.84%; and in the Senate similarly, also placing 3rd behind the two major parties and ahead of the Greens with a combined vote of 2,172,775 (12.62%). By my reckoning this makes the “negative political party” a potentially powerful force in Australian politics.
I have taken my terminology of the “negative political party” from the brilliant and clever essay by Frédéric Bastiat called “Un chemin de fer négativ” (The Negative Railway) which was first published in his first collection of Economic sophisms which was published in 1846. [English version CW3, p. 81; French version here.] In this essay, he satirises the politicians and rent-seekers who want to force the railway company building a new line from Bordeaux to Spain to have as many stops as possible in order to benefit the local restaurants and hotels near the railway station who would profit by forcing the passengers to stop, change trains, and move their luggage, and possibly have to stay overnight. This, they argued, would increase work, wages, and thus increase the national wealth. Bastiat mockingly implies that if this were true, then the more “breaks” in the line the better, so many in fact that the railway would no longer be a railway at all, as the passengers and their luggage would never get to their destination, but the “nation’s wealth” would supposedly have been increased by these measures.
[Note: In the edition I edited for Liberty Fund I included in the Appendix a witty piece by Mark Twain who noticed something similar when he was visiting Australia, in having to change trains in the middle of the night at Albury on his way to Melbourne from Sydney. See CW3 – Appendix 5. Mark Twain and the Australian Negative Railroad, 517.]
The House of Representatives
Data source: the Australian Electoral Commission website for the 2022 election results; for the 2019 election results.
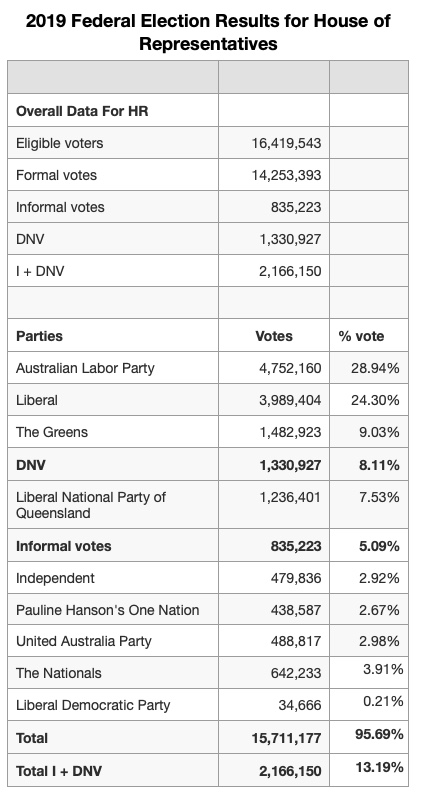
In the 2019 election in the HR there were the following:
- 16,419,543 eligible voters of whom
- 14,253,393 (86.68%) voted “formally” (i.e. in the government approved manner) and
- 835,223 (5.09%) voted informally for a combined total of 91.77%.
- 1,330,927 (8.11%) Did Not Vote (DNV)
- which made a total of 2,166,150 (13.19%) who did not vote or whose vote was not counted (I+DNV). If this group were considered as a “negative candidate” or a “negative party” it would have placed 3rd behind the two major parties and ahead of the Greens with a combined vote of 2,166,150 or 13.19%.
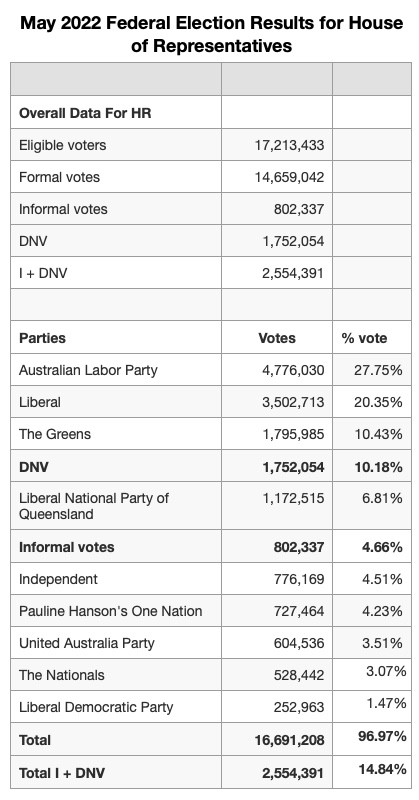
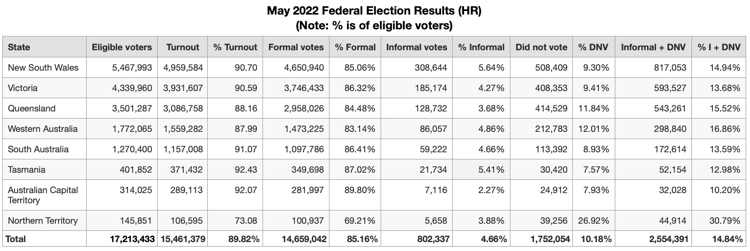
In the 2022 election in the HR there were the following:
- 17,213,433 eligible voters of whom
- 14,659,942 (85.16%) voted “formally” and
- 802,337 (4.66%) voted informally for a combined total of 89.83%
- 1,752,054 (10.18%) DNV
- which made a total of 2,554,391 (14.84%) who did not vote or whose vote was not counted (I+DNV). If this group were considered as a “negative candidate” or a “negative party” it would have placed 3rd behind the two major parties and ahead of the Greens with a combined vote of 2,554,391 or 14.84%.
[See a larger version.]
Thus compared to 2019, in 2022 there was
- a slight decline in the number “formal” votes (86.68% down to 85.16%) as well as “informal” votes (5.09% down to 4.66%).
- but there was an increase in those who DNV, up from 8.11% to 10.18%. In absolute numbers this was an increase of 421,127, which is a sizable number of the eligible voters (2.45% of all eligible voters)
- thus the total number of people who did not vote or whose vote was not counted (I+DNV) increased from 13.19% to 14.84%, or in absolute terms 388,241 people
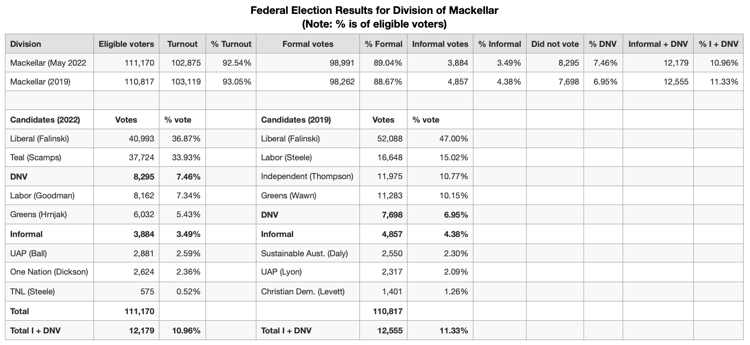
In the NSW seat/division of Mackellar in the Northern Beaches region of Sydney a safe Liberal seat was won by one of the new “Teal” light Green independents. The sitting Liberal member won the primary vote (36.87%) but the collapse in the votes for the Labor candidate (from 15% to 7,34%) and the Green candidate (10.15% to 5.43%) meant that he second place Teal candidate won on preferences with 34% of the primary vote. Compared to the 2019 election, the informal vote decreased slightly (from 4.38% to 3.49%) and the DNV increased slightly from 6.95% to 7.46%). The combined I + DNV decreased slightly from 11.33% of the vote to 10.96%. With the collapse in the vote for the Labor Party, the previous Independent (now replaced by the Teal), and the Greens, the DNV “candidate” went from 5th position ion 2019 to 3rd in 2022.
See a larger version.
The Senate
To simplify a very complex matter, I will only consider the primary vote for Senate candidate, nit the final, allocation of seats by quota.
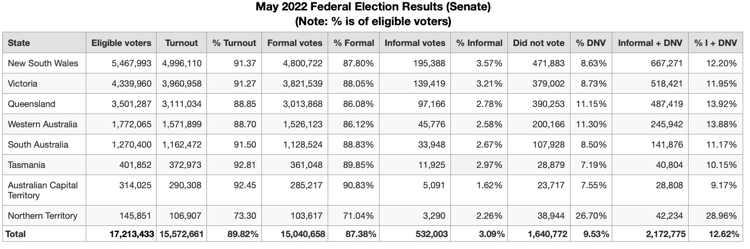
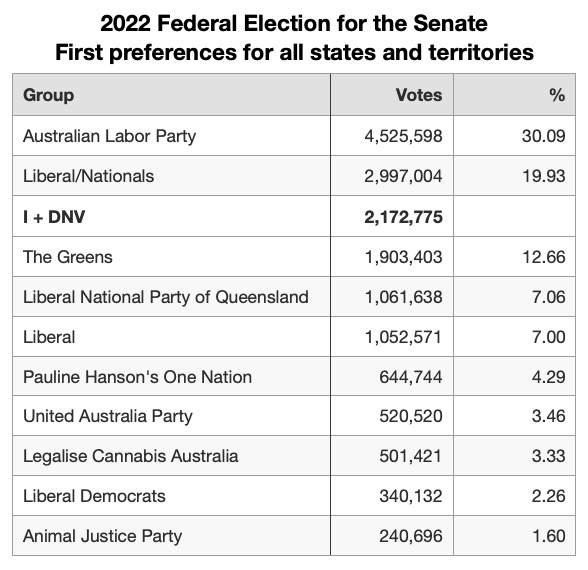
In the 2022 election there were the following
- 17,213,433 eligible voters, of whom
- 15,040,658 (87.38%) voted “formally” and
- 532,003 (3.09%) voted “informally” for a combined total of 15,213,433 (89.82%)
- 1,640,772 (9.53%) Did Not Vote
- which made a total of 2,172,775 (12.62%) who did not vote or whose vote was not counted (I+DNV). If this group were considered as a “negative candidate” or a “negative party” it would have placed 3rd behind the two major parties and ahead of the Greens with a combined vote of 2,172,775 (12.62%).
- 40 of the 76 Senates seats were contested with the Greens winning 6, Labor 11, and Liberal/National 17. Who knows how many seats my “negative political party” might of won in this election.
[See a larger version
Conclusion
The large number of disaffected, disillusioned, and indifferent voters in Australia is large and increasing as voters turn off the mainstream political parties and either look elsewhere among the smaller parties and independents, or give up and could no longer be bothered with voting at all. My “negative political party” is one way to measure this disaffection. All this party needs now is a “negative prime minister” to whip it into shape.