Saturday - March 31, 2012
The Aesthetics of the Scientific Depiction of State-Inflicted Megadeath II.
The Aesthetics of the Scientific Depiction of State-Inflicted Megadeath II.
[See Part I of this essay]
The following consists of extracts from Robock, Oman, and Stenchikov (2007) with a selection of the graphs and tables they used to illustrate their scientific paper on the effects of a "nuclear winter" which is predicted to occur after a nuclear exchange. These quite attractive and eye-catching illustrations depict the horrific consequences of the aftermath of a nuclear war in which hundreds of millions of people die, in addition to the millions who would die in the immediate explosions.
[Alan Robock, Luke Oman, and Georgiy L. Stenchikov, "Nuclear winter revisited with a modern climate model and current nuclear arsenals: Still catastrophic consequences" Journal of Geophysical Research – Atmospheres, Vol. 112, No. D13, 2007. <http://climate.envsci.rutgers.edu/pdf/RobockNW2006JD008235.pdf>].
Summary
[1] Twenty years ago, the results of climate model simulations of the response to smoke and dust from a massive nuclear exchange between the superpowers could be summarized as ‘‘nuclear winter,’’ with rapid temperature, precipitation, and insolation drops at the surface that would threaten global agriculture for at least a year. The global nuclear arsenal has fallen by a factor of three since then, but there has been an expansion of the number of nuclear weapons states, with additional states trying to develop nuclear arsenals. We use a modern climate model to reexamine the climate response to a range of nuclear wars, producing 50 and 150 Tg of smoke, using moderate and large portions of the current global arsenal, and find that there would be significant climatic responses to all the scenarios. This is the first time that an atmosphere-ocean general circulation model has been used for such a simulation and the first time that 10-year simulations have been conducted. The response to the 150 Tg scenario can still be characterized as ‘‘nuclear winter,’’ but both produce global catastrophic consequences. The changes are more long-lasting than previously thought, however, because the new model, National Aeronautics and Space Administration Goddard Institute for Space Studies ModelE, is able to represent the atmosphere up to 80 km, and simulates plume rise to the middle and upper stratosphere, producing a long aerosol lifetime. The indirect effects of nuclear weapons would have devastating consequences for the planet, and continued nuclear arsenal reductions will be needed before the threat of nuclear winter is removed from the Earth.
1. Introduction
[2] As first suggested by Crutzen and Birks [1982], climate model simulations by Turco et al. [1983] and Aleksandrov and Stenchikov [1983] showed that a full-scale nuclear war would produce surface temperature, precipita- tion, and insolation reductions so large that the climatic consequences were described as ‘‘nuclear winter.’’ Soon after the world was confronted with the prospect of potential indirect effects of nuclear war much larger than the direct effects, and starvation of billions of people from the collapse of world agriculture, the arms race and cold war ended. Since then, the global nuclear arsenal has been reduced by a factor of three…
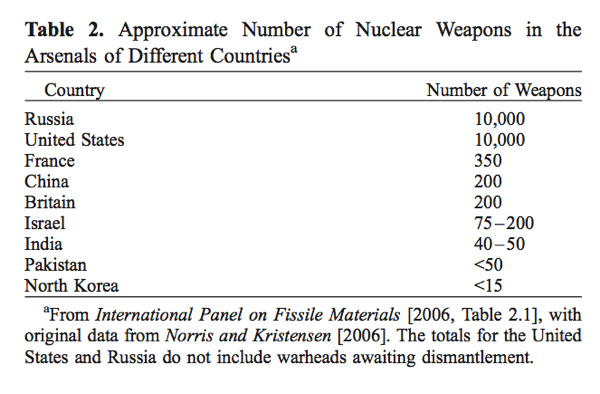
[3] Prompted by the recent work of Toon et al. [2007] and Robock et al. [2007], who showed that a regional nuclear conflict using 100 Hiroshima-size (15 kt) nuclear weapons, only 0.03% of the explosive power of the current global arsenal, would produce climate change unprecedented in human history, we revisit the nuclear winter issue with a modern climate model. We ask the question of whether the current nuclear arsenal could still produce a nuclear winter.
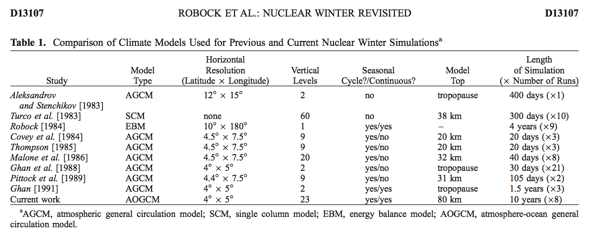
[4] All previous simulations of the climatic response to the smoke generated from a nuclear war were limited by computer power and the available climate models. As shown in Table 1, each simulation addressed certain aspects of the climate model response with simple climate models or with short simulations of low-resolution atmospheric general circulation models (GCMs), but now for the first time we use a coupled atmosphere-ocean GCM run contin- uously for multiple 10-year simulations and with a model top at the mesopause.
4. Results for the 150 Tg Case
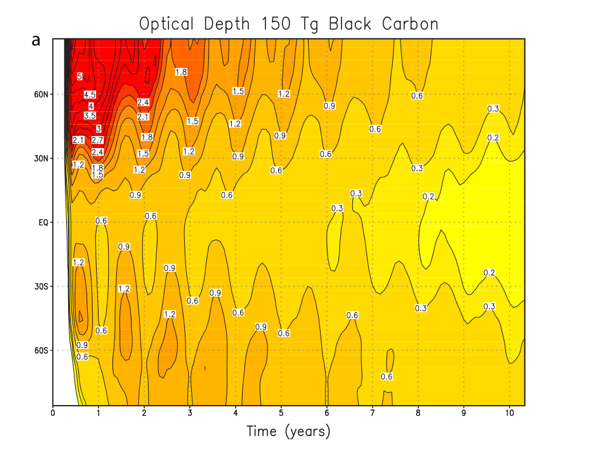
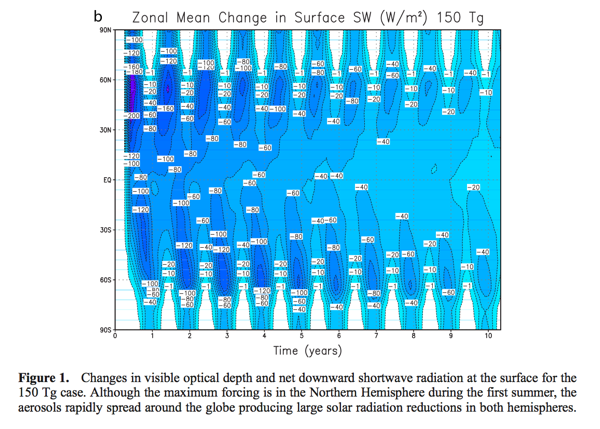
[19] As found by Robock et al. [2007] for a 5 Tg case, the black carbon particles in the aerosol layer for the 150 Tg case are heated by absorption of shortwave radiation and lofted into the upper stratosphere. The aerosols quickly spread globally and produce a long-lasting climate forcing (Figure 1). They end up much higher than is typical of weakly absorbing volcanic sulfate aerosols, which typically are just above the tropopause [Stenchikov et al., 1998]. As a result, the soot aerosols have a very long residence time and continue to affect surface climate for more than a decade. The mass e-folding time for the smoke is 4.6 years, as compared to 1 year for typical volcanic eruptions [Oman et al., 2006a] and 1 week for tropospheric aerosols. After 4.6 years, the e-folding time is reduced, but is still longer than that of volcanic aerosols. In addition to the lofting of the smoke by solar absorption, another reason for this difference is that volcanic sulfate aerosols are larger, with an effective radius of 0.5 mm, and thus they have a higher settling velocity than the smaller smoke aerosols. This long smoke aerosol lifetime is different from results found in previous nuclear winter simulations, which either fixed the vertical extent of the aerosols [Turco et al., 1983] or used older-generation climate models with limited vertical reso- lution and low model tops [Aleksandrov and Stenchikov, 1983; Covey et al., 1984; Malone et al., 1986], artificially limiting the particle lifetimes.
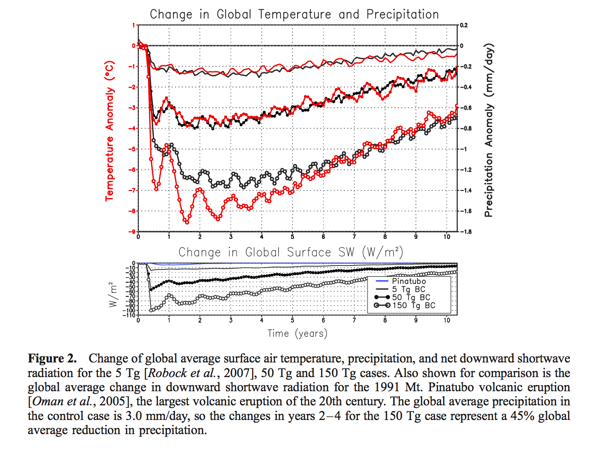
[20] The maximum change in net global average surface shortwave radiation for the 150 Tg case is 100 W m2 (Figure 2). This negative forcing persists for many years, with the global average value still at 20 W m2 even 10 years after the initial smoke injection. This forcing greatly exceeds the maximum global average surface forcing of 4 W m2 for the 1991 Mt. Pinatubo volcanic eruption [Kirchner et al., 1999; Oman et al., 2005], the largest of the 20th century, also shown in Figure 2. The volcanic forcing disappeared with an e-folding time of only 1 year, and during the first year averaged 3.5 W m2 (Figure 2).
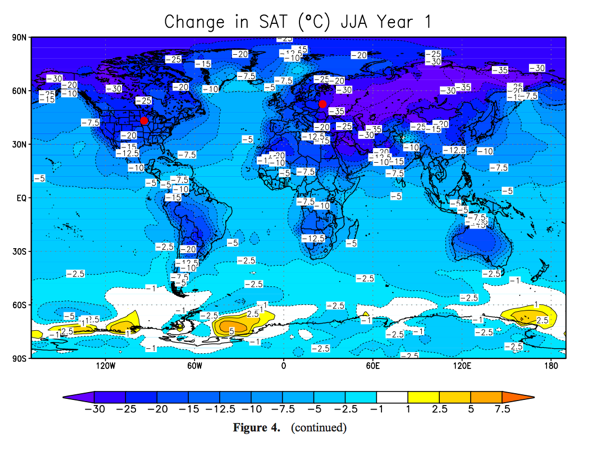
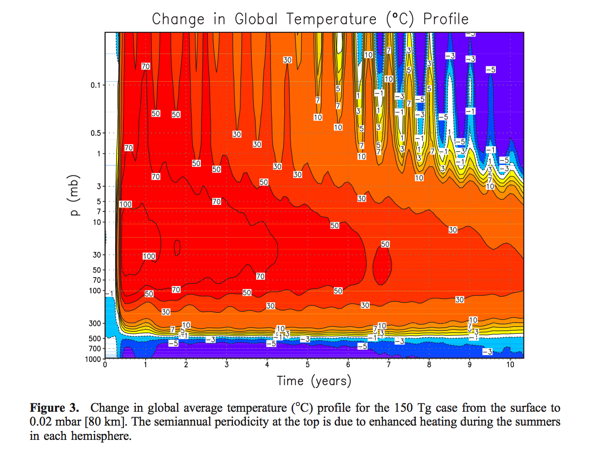
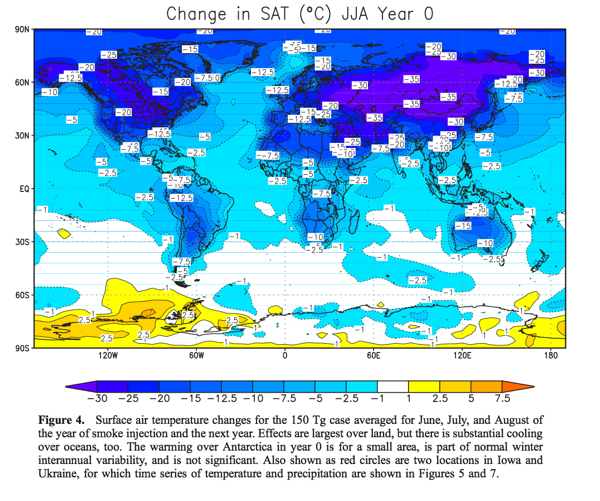
[21] The effects of the smoke cloud on surface tempera- ture are extremely large (Figure 2). Stratospheric temper- atures are also severely perturbed (Figure 3). A global average surface cooling of 7°C to 8°C persists for years, and after a decade the cooling is still 4°C (Figure 2). Considering that the global average cooling at the depth of the last ice age 18,000 years ago was about 5°C, this would be a climate change unprecedented in speed and amplitude in the history of the human race. The temperature changes are largest over land. Maps of the temperature changes for the Northern Hemisphere summers for the year of smoke injection (year 0) and the next year (year 1) are shown in Figure 4. Cooling of more than 20°C occurs over large areas of North America and of more than 30°C over much of Eurasia, including all agricultural regions. There are also large temperature changes in the tropics and over Southern Hemisphere continents. Large climatic effects would occur in regions far removed from the target areas or the countries involved in the conflict.
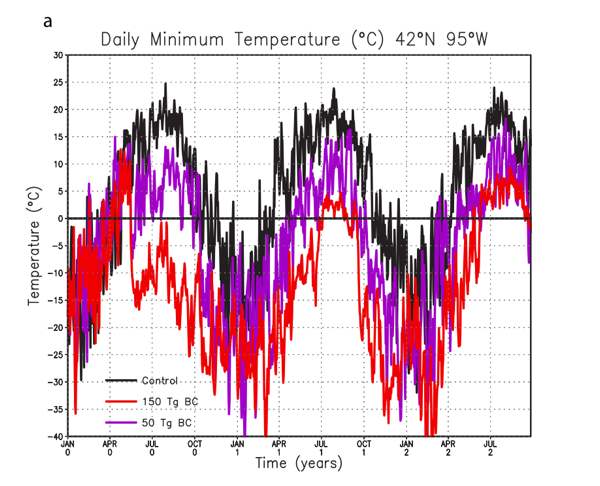
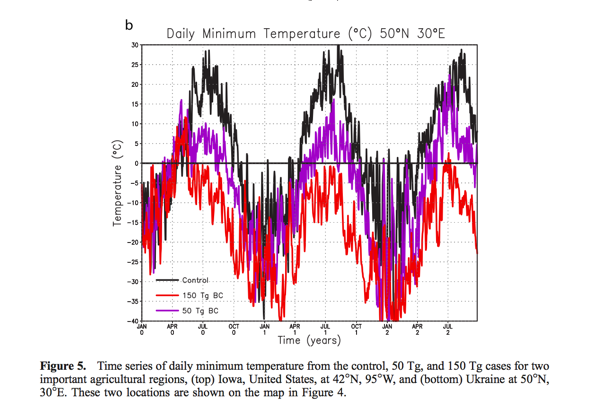
[22] As examples of the actual temperature changes in important grain-growing regions, we have plotted the time series of daily minimum air temperature for grid points in Iowa, United States, at 42°N, 95°W, and in Ukraine at 50°N, 30°E (Figure 5). For both locations (shown in Figure 4), minimum temperatures rapidly plummet below freezing and stay there for more than a year. In Ukraine, they stay below freezing for more than two years. Clearly, this would have agricultural implications.
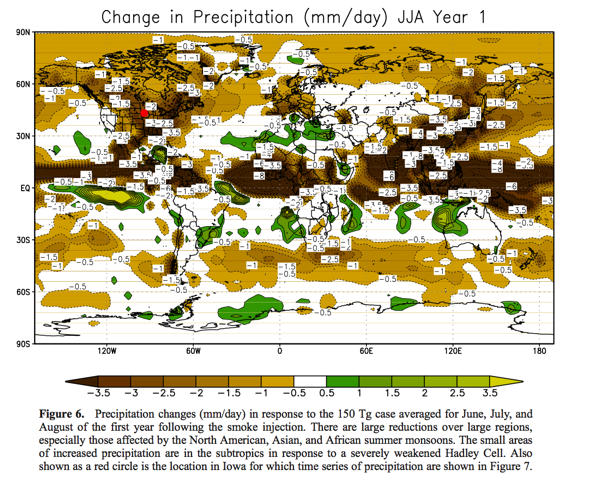
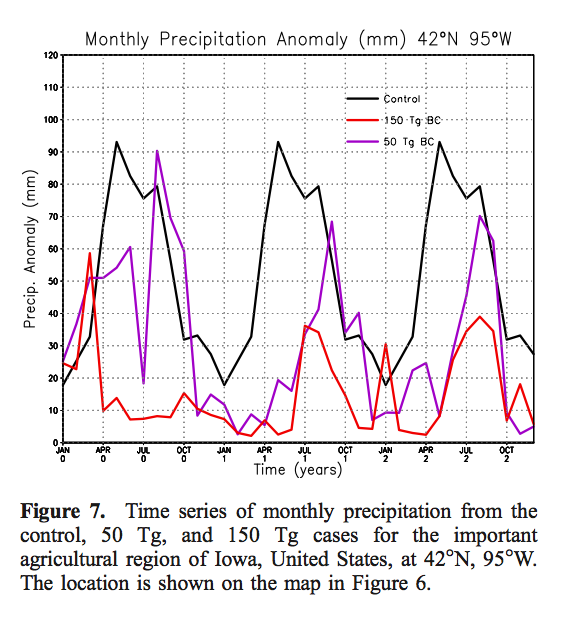
[23] As a result of the cooling of the Earth’s surface, evapotranspiration is reduced and the global hydrological cycle is weakened. In addition, Northern Hemisphere sum- mer monsoon circulations collapse, because the driving continent-ocean temperature gradient does not develop. The resulting global precipitation is reduced by about 45% (Figure 2). As an example, Figure 6 shows a map of precipitation change for the Northern Hemisphere summer one year after the smoke injection. The largest precipitation reductions are in the Intertropical Convergence Zone and in areas affected by the North American, Asian, and African summer monsoons. The small areas of increased precipitation are in the subtropics in response to a severely weakened Hadley Cell. Figure 7 shows time series of monthly pre- cipitation for the same Iowa location as shown in Figure 5, and it is clear that these large precipitation reductions would also have agricultural implications.
[24] This is the first time an atmosphere-ocean general circulation model of the climate system has been used to study nuclear winter. It is the first one to be able to estimate the amplitude and timescale of ocean cooling, and to evaluate the time the system will need to return to the previous equilibrium. This is because the model explicitly models the effects of the thermal inertia of the ocean at different depths, as well as oceanic circulation changes. The long-lasting climate response to this smoke injection is a combination of the ability of the model to loft the soot aerosols high into the stratosphere, and of the ability of the model to calculate the characteristic response time of the climate system.
6. Impacts
[28] The amplitude of the climate changes from the 5 Tg, 50 Tg and 150 Tg cases are compared to those from global warming of the past century in Figure 8 and climate change of the past 1000 years in Figure 9. In both cases it is clear that all cases would produce unprecedented long-lasting climate change. The 50 Tg and 150 Tg cases produce cooling as large or larger than that experienced 18,000 years ago during the coldest period of the last Ice Age.
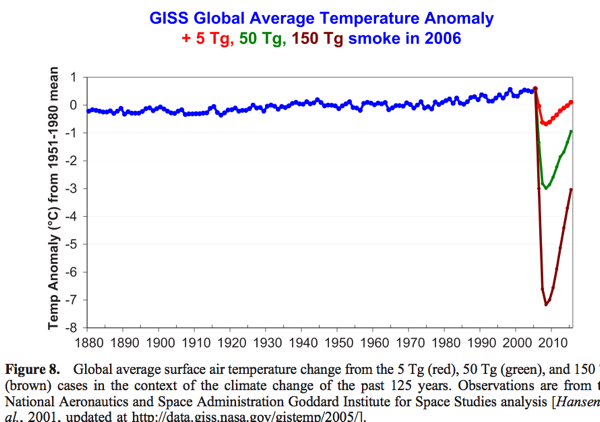
[29] Harwell and Hutchinson [1986] clearly described the impacts of nuclear winter. They assumed that there would be no food production around the world for one year and concluded that most of the people on the planet would run out of food and starve to death by then. Our results show that this period of no food production needs to be extended by many years, making the impacts of nuclear winter even worse than previously thought.
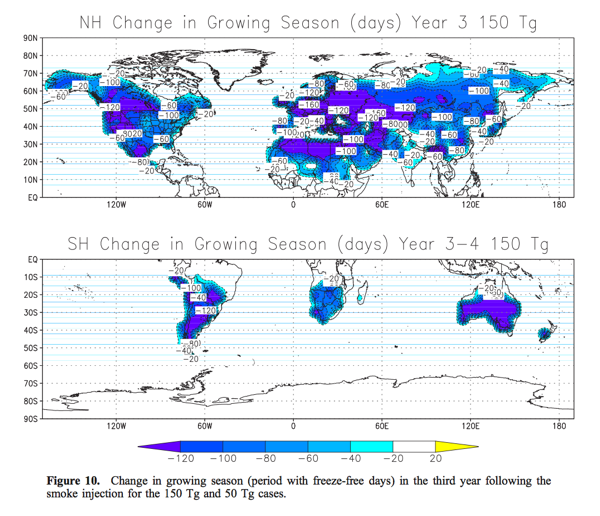
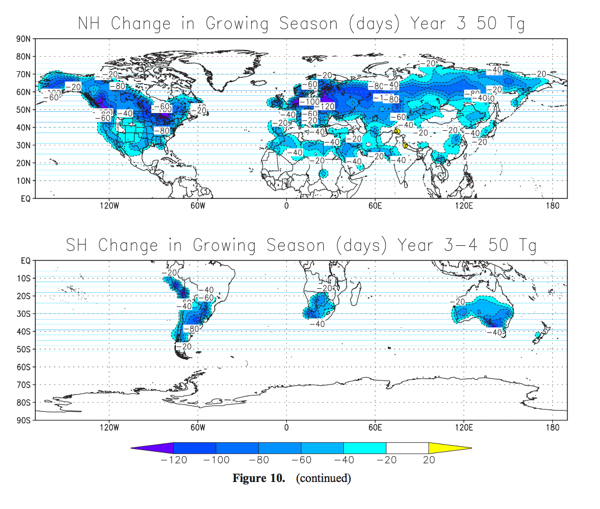
[30] Agriculture would be affected by many factors, including temperature changes, precipitation changes, and changes in insolation [e.g., Robock et al., 1993; Mayt ́ın et al., 1995]. As an example, Figure 10 shows changes in the length of the freeze-free growing season for the third full growing seasons in the Northern and Southern Hemi- spheres. Such large reductions in growing season would completely eliminate crops that have insufficient time to reach maturity. Also, global ozone loss is likely [Toon et al., 2007], with effects on downward ultraviolet radiation [Vogelmann et al., 1992] and atmospheric circulation. Further analysis of these and other effects, which is beyond the scope of this paper, is needed.
